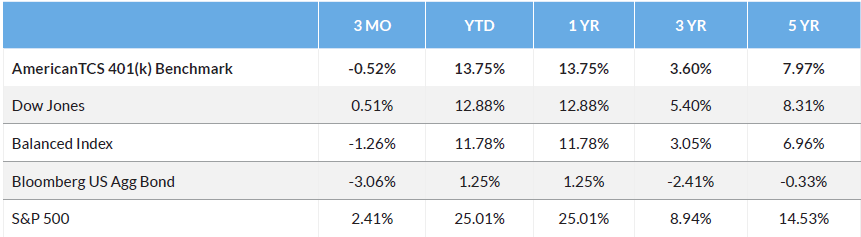
The AmericanTCS 401(k) Composite Benchmark delivered a –0.52% return in the third quarter of 2024, slightly better than the –1.26% return of the 60/40 Balanced Index.
Over the same period the S&P 500 Index (large cap U.S. stocks) returned 2.41% as it experienced heightened volatility after a post-election, growth-led rally. The Bloomberg U.S. Aggregate Bond Index (taxable U.S. bonds) saw yields rise on inflation concerns, ultimately declining -3.06% in the fourth quarter.
Because 401(k) participants are long-term investors it is important to take a step back and look at the hypothetical 401(k) participant’s journey over longer time periods. The AmericanTCS 401(k) Benchmark delivered a solid return of 7.97% over the last five-year period. This reaffirms the experts’ advice to 401(k) participants of the importance of staying the course even in volatile markets. History tells us that good markets often follow bad ones. To achieve long-term financial success and stability, 401(k) participants must maintain a committed approach to their 401(k) portfolio.
About the AmericanTCS 401(k) Benchmark
AmericanTCS is a leading financial services organization that provides a wide array of brokerage, advisory, and trust services to a diverse national client base of financial advisors and institutions, asset managers, and benefits administrators through its various affiliated companies. Because we provide these services, AmericanTCS has plan investment data on over 100,000 401(k) plans representing approximately $146 billion in assets. In response to requests from our institutional clients, we have created the AmericanTCS 401(k) Composite Benchmark. Using data from plans serviced by AmericanTCS with assets of at least $100,000 at the beginning and ending of the month, the AmericanTCS 401(k) Composite Benchmark is designed to reflect the portfolio performance across 401(k) plans serviced, in any capacity, by AmericanTCS. See the “Methodology” section of this report for details on how the composite benchmark is calculated.